


 84 / 98

Vodacom Group Limited
Integrated report for the year ended 31 March 2016
80
Share
information
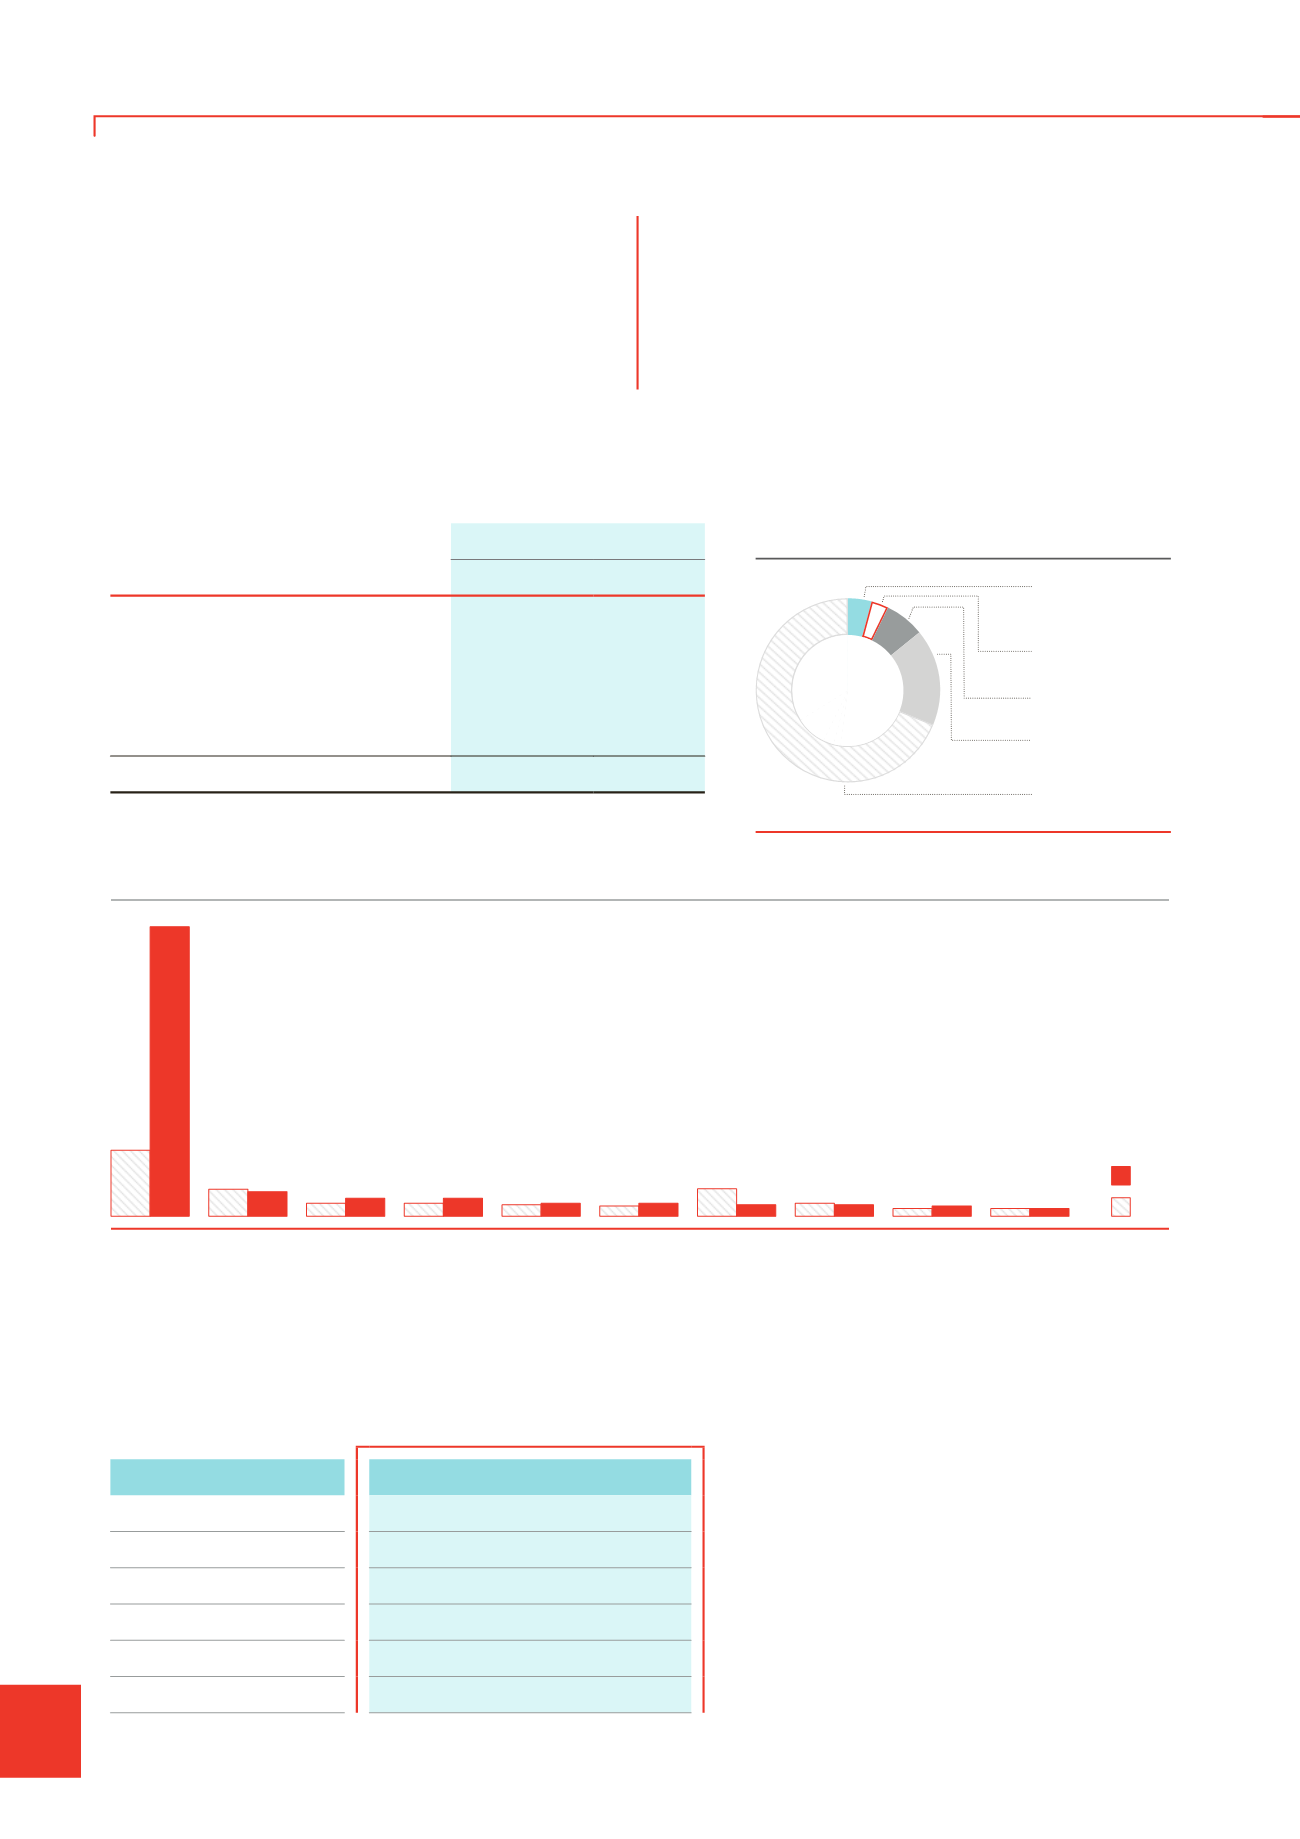
Total shareholding:
March 2016
# of shares % holding
Vodafone Investments SA (Pty) Limited
967 170 100
65.00
Government Employees Pension Fund
188 465 933
12.67
Wheatfield Investments 276 (Pty) Limited
15 421 231
1.04
Institutional investors
266 039 534
17.88
Retail positions
28 790 263
1.93
Other
1
22 066 939
1.48
1 487 954 000
100.00
1. Balance of remaining holdings, including shares below analysis threshold. May include additional
institutional/retail shareholdings.
17%
United States
3%
Rest of Europe
69%
South Africa
4%
Rest of world
Institutional shareholding (%)
7%
United Kingdom
Top ten institutional investors as at 31 March (millions of shares)
2016
2015
51
228
21
19
10
14
10
14
9 10
8 10
0.2
9
10 9
6 8
6 6
PIC (ZA)
Lazard Asset
Management LLC (US)
STANLIB Asset
Management (ZA)
Old Mutual Investment
Group SA (ZA)
The Vanguard
Group Inc (US)
BlackRock Advisors
LLC (US)
Investec Asset
Management (ZA)
Schroder Investment
Management Ltd (UK)
Sanlam Investment
Management (Pty) Ltd (ZA)
GIC Asset Management
Pte Ltd (SG)
Ticker symbol
VOD
ADR code
VDMCY
Stock exchange
JSE Limited
Shares in issue
1 487 954 000
Freefloat
35%
Debt rating
Long-term scaling zaAAA (S&P)
Transfer agent
Computershare