


 87 / 102

Our business
Operating context
Delivering on our strategy
Our governance structure
Administration
83
Dividend per share
(cents per share)
■
Final dividend
■
Interim dividend
400
375
400
395
395
FY15
FY16
FY17
775
795
435
830
Shareholder return for the year ended 31 March 2017
Tuesday
18 July 2017
Vodacom Group AGM
Thursday
20 July 2017
Q1 results for the quarter
ended 30 June 2017
Monday
13 November 2017
Interim results for the
six months ended
30 September 2017
2017 Investor relations calendar
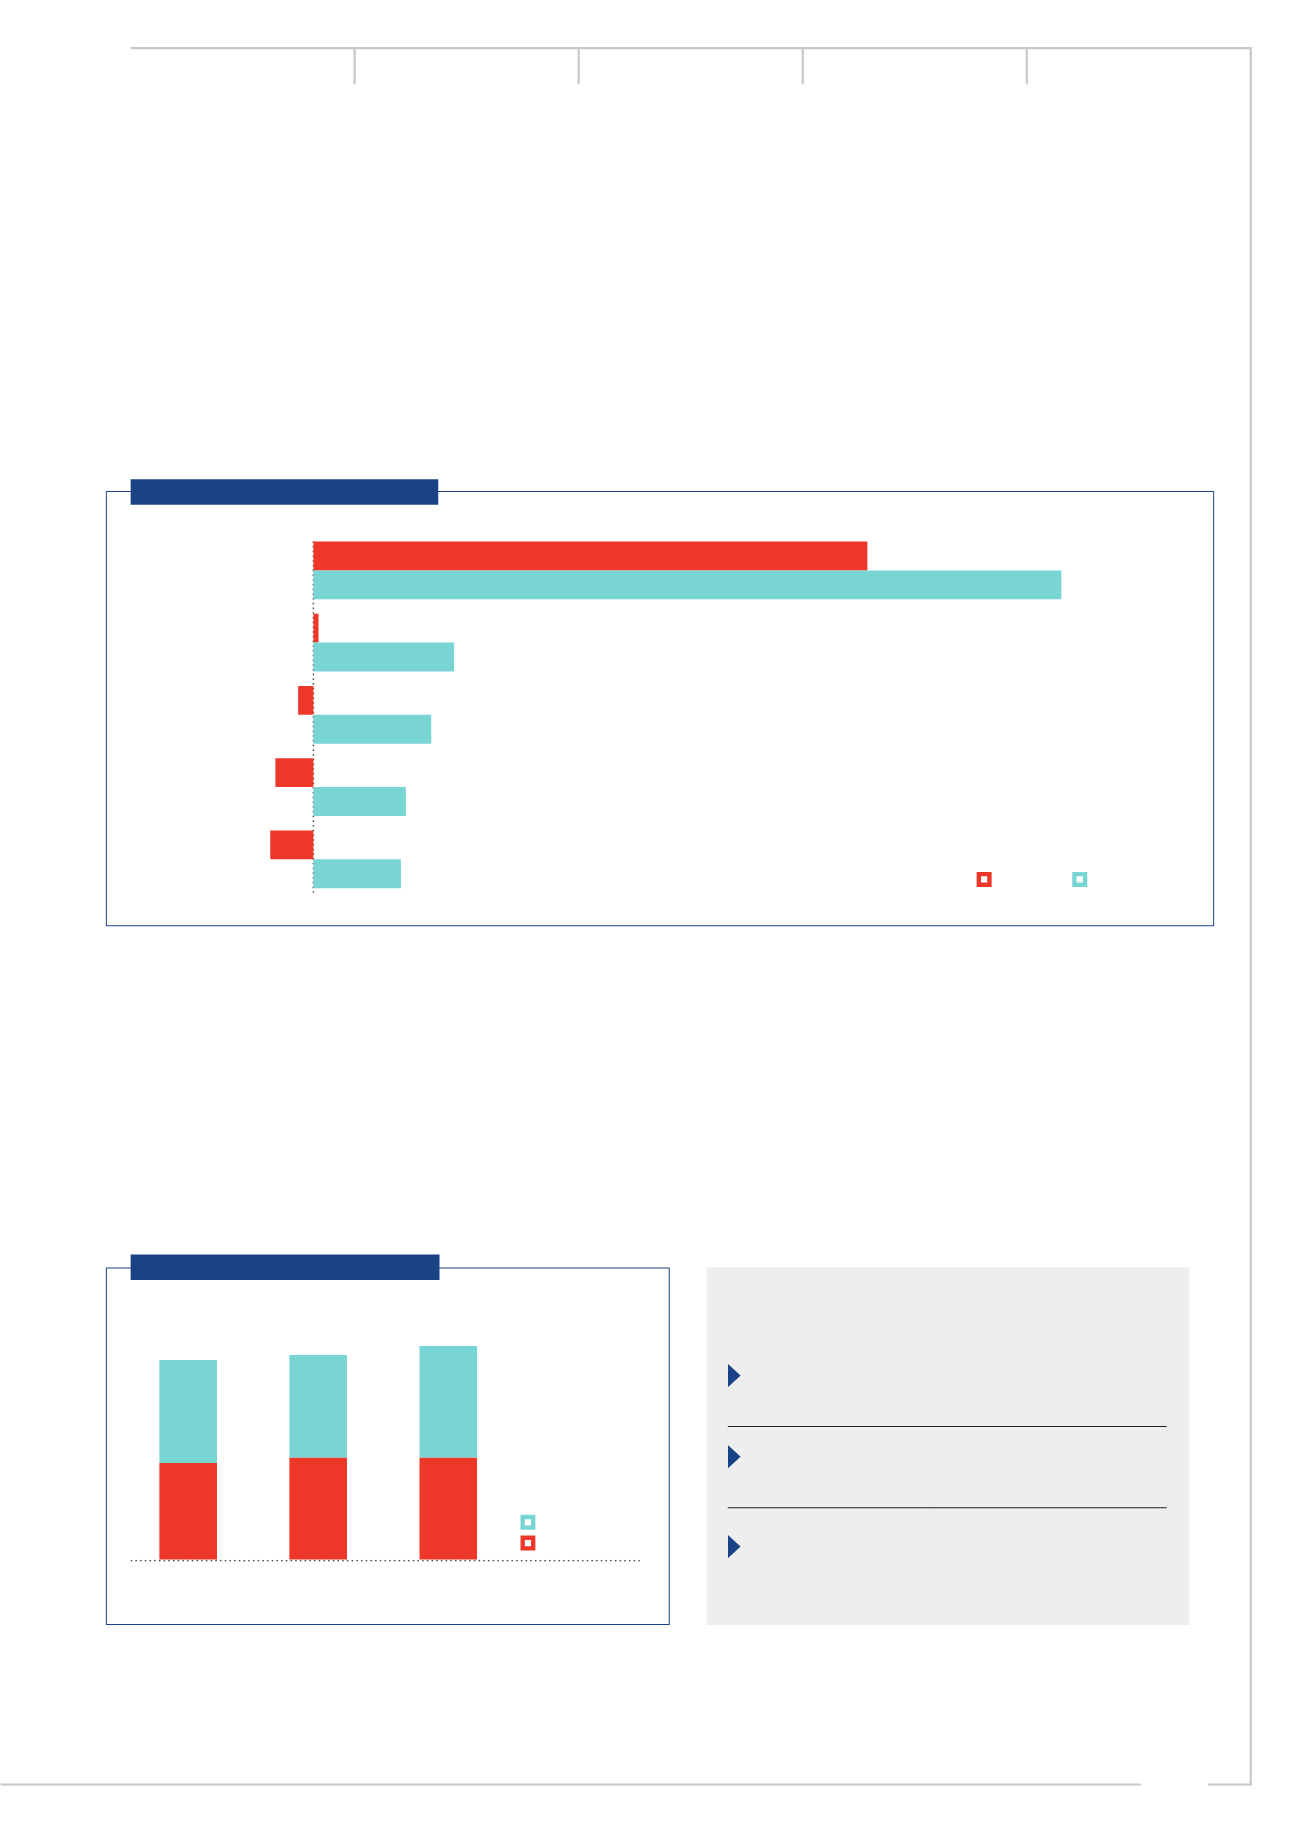
Comparative shareholder return (%)
Dividend per share (cents per share)
Total shareholder return
(%)
■
ZAR
■
US$
Telkom
Vodacom
MTN
Millicom
Bharti
43.7
0.4
(1.2)
(3.0)
(3.4)
59.0
11.1
9.3
7.3
6.9
R152.00
Vodacom share price closed at
on 31 March 2017 with a closing high of R171.10 and a closing
low of R140.00 during the period.
Source: Factset