



 27 / 98

Our performance
Our business
Governance review
Administration
Overview
23
Progress at
Strategic pillar
Measure
31 March 2018
31 March 2016
31 March 2015
Customer
Service revenue
market share
Market leader in
all markets
#1
in all markets for service
revenue market share
#1
in all markets for service
revenue market share
NPS score
#1
in all markets
#1
in all markets, except
Tanzania (#3) and the DRC (#4)
#1
in all markets except
Tanzania (#2) and the DRC (#3)
Brand leadership
position
#1
in South Africa
65%^
#1 in South Africa
63%
^
#1 in South Africa
Growth
Data revenue
contribution
40%
of Group service revenue
31.9%
^
26.7%
Enterprise
contribution
30%
of Group service revenue
20.5%
^
18.4%
Fixed-line
connections
Increase number
of connections
1 223
^
connections
Soft-launched
Non-South African
entities
contribution
30%
of Group service revenue
26.6%
^
24.6%
New services
contribution
5%
of Group service revenue
4.2%
^
3.9%
Operations
Cost growth
vs service
revenue growth
0.5 ppts
lower than service revenue
growth
2.4 ppts
^
lower
2.2 ppts
higher
People
Engagement Score
80
76
^
76
Reputation
Reputation Survey
#1
in all markets
#1
in South Africa
Not measured
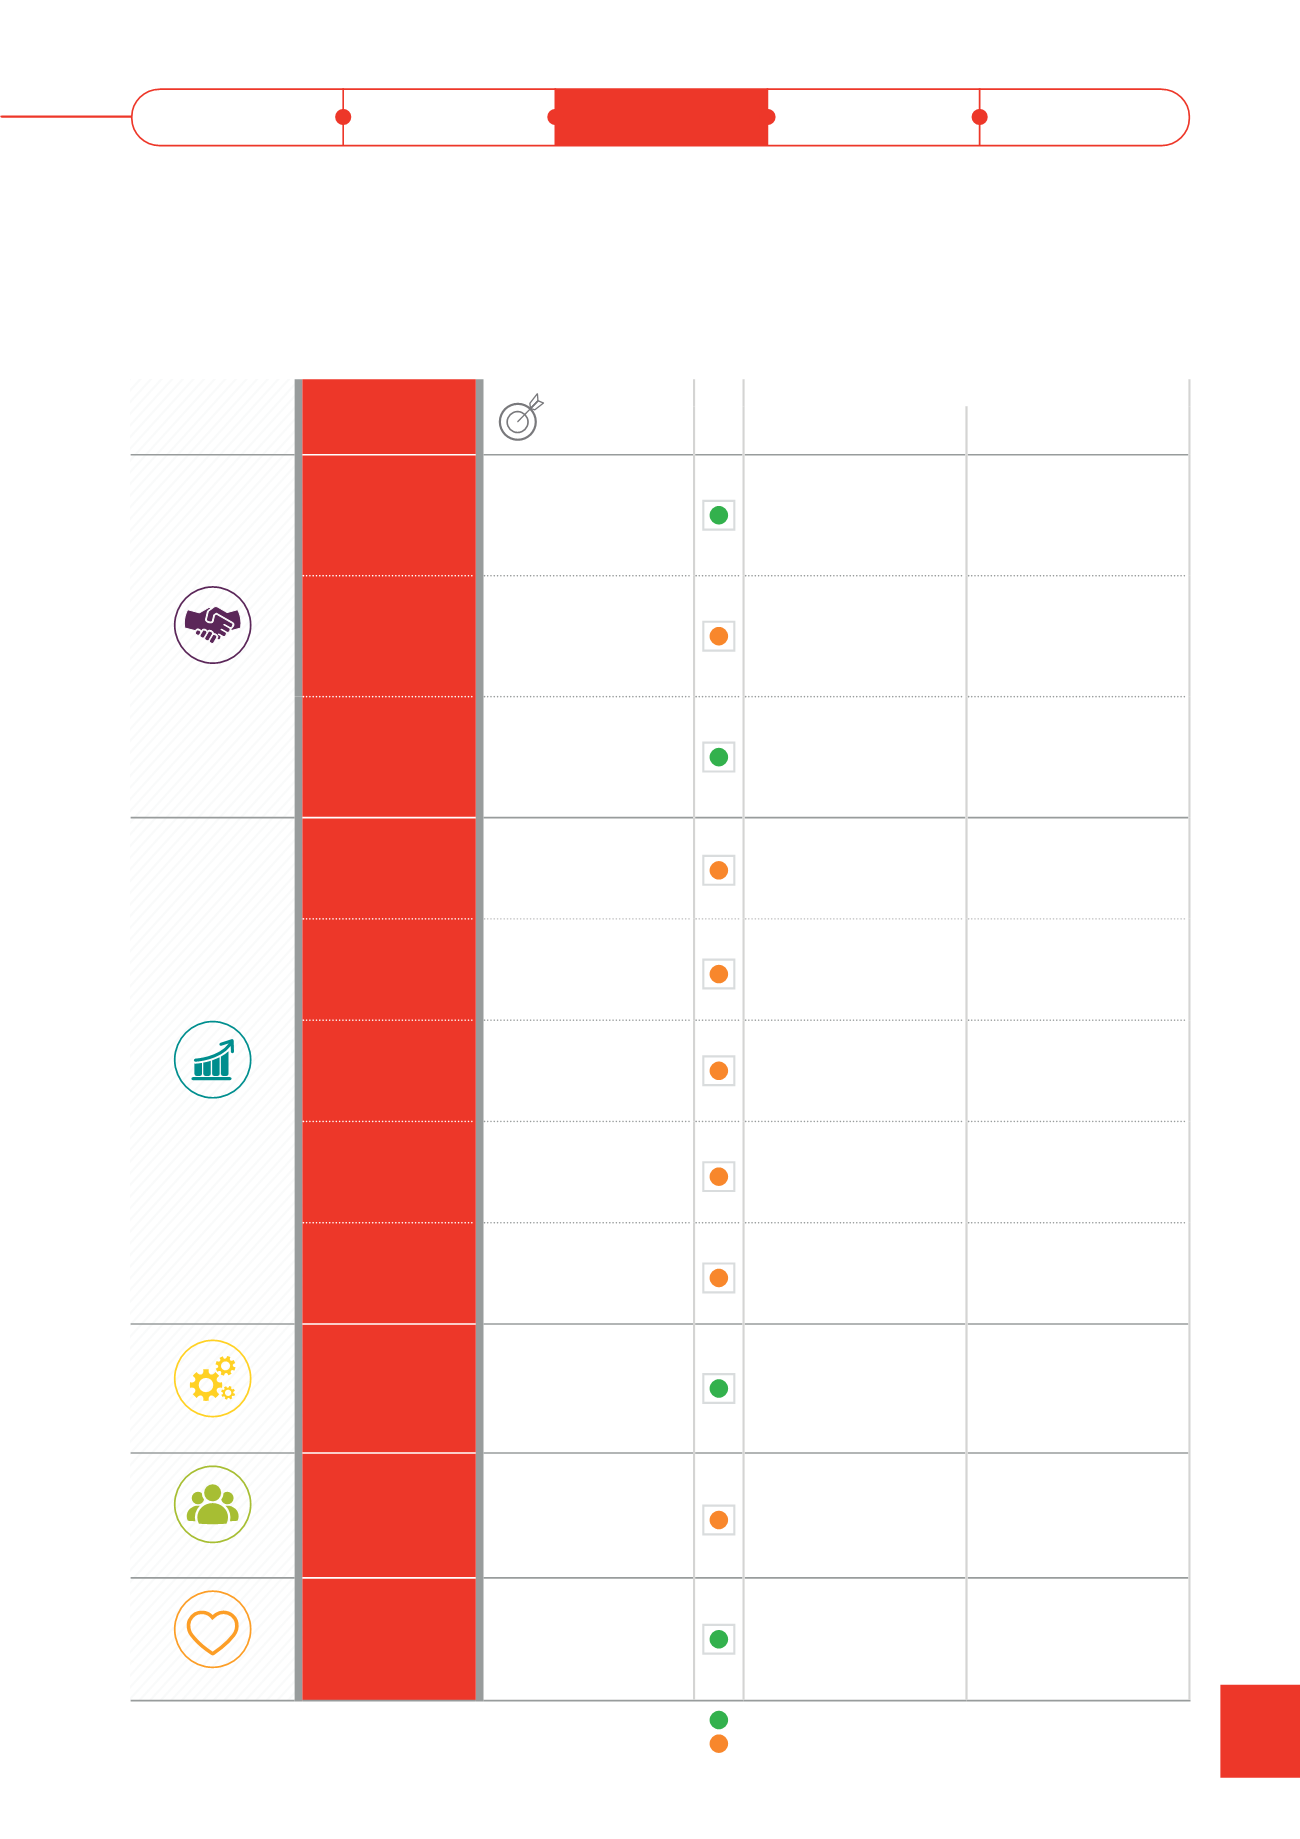
Last year we set three-year goals with related targets for each of our five strategies.
Our strategic performance: at a glance
^ These items were the subject of the limited assurance engagement performed by EY.
Achieved target.
On track to achieve target.