



 12 / 98

Vodacom Group Limited
Integrated report for the year ended 31 March 2016
08
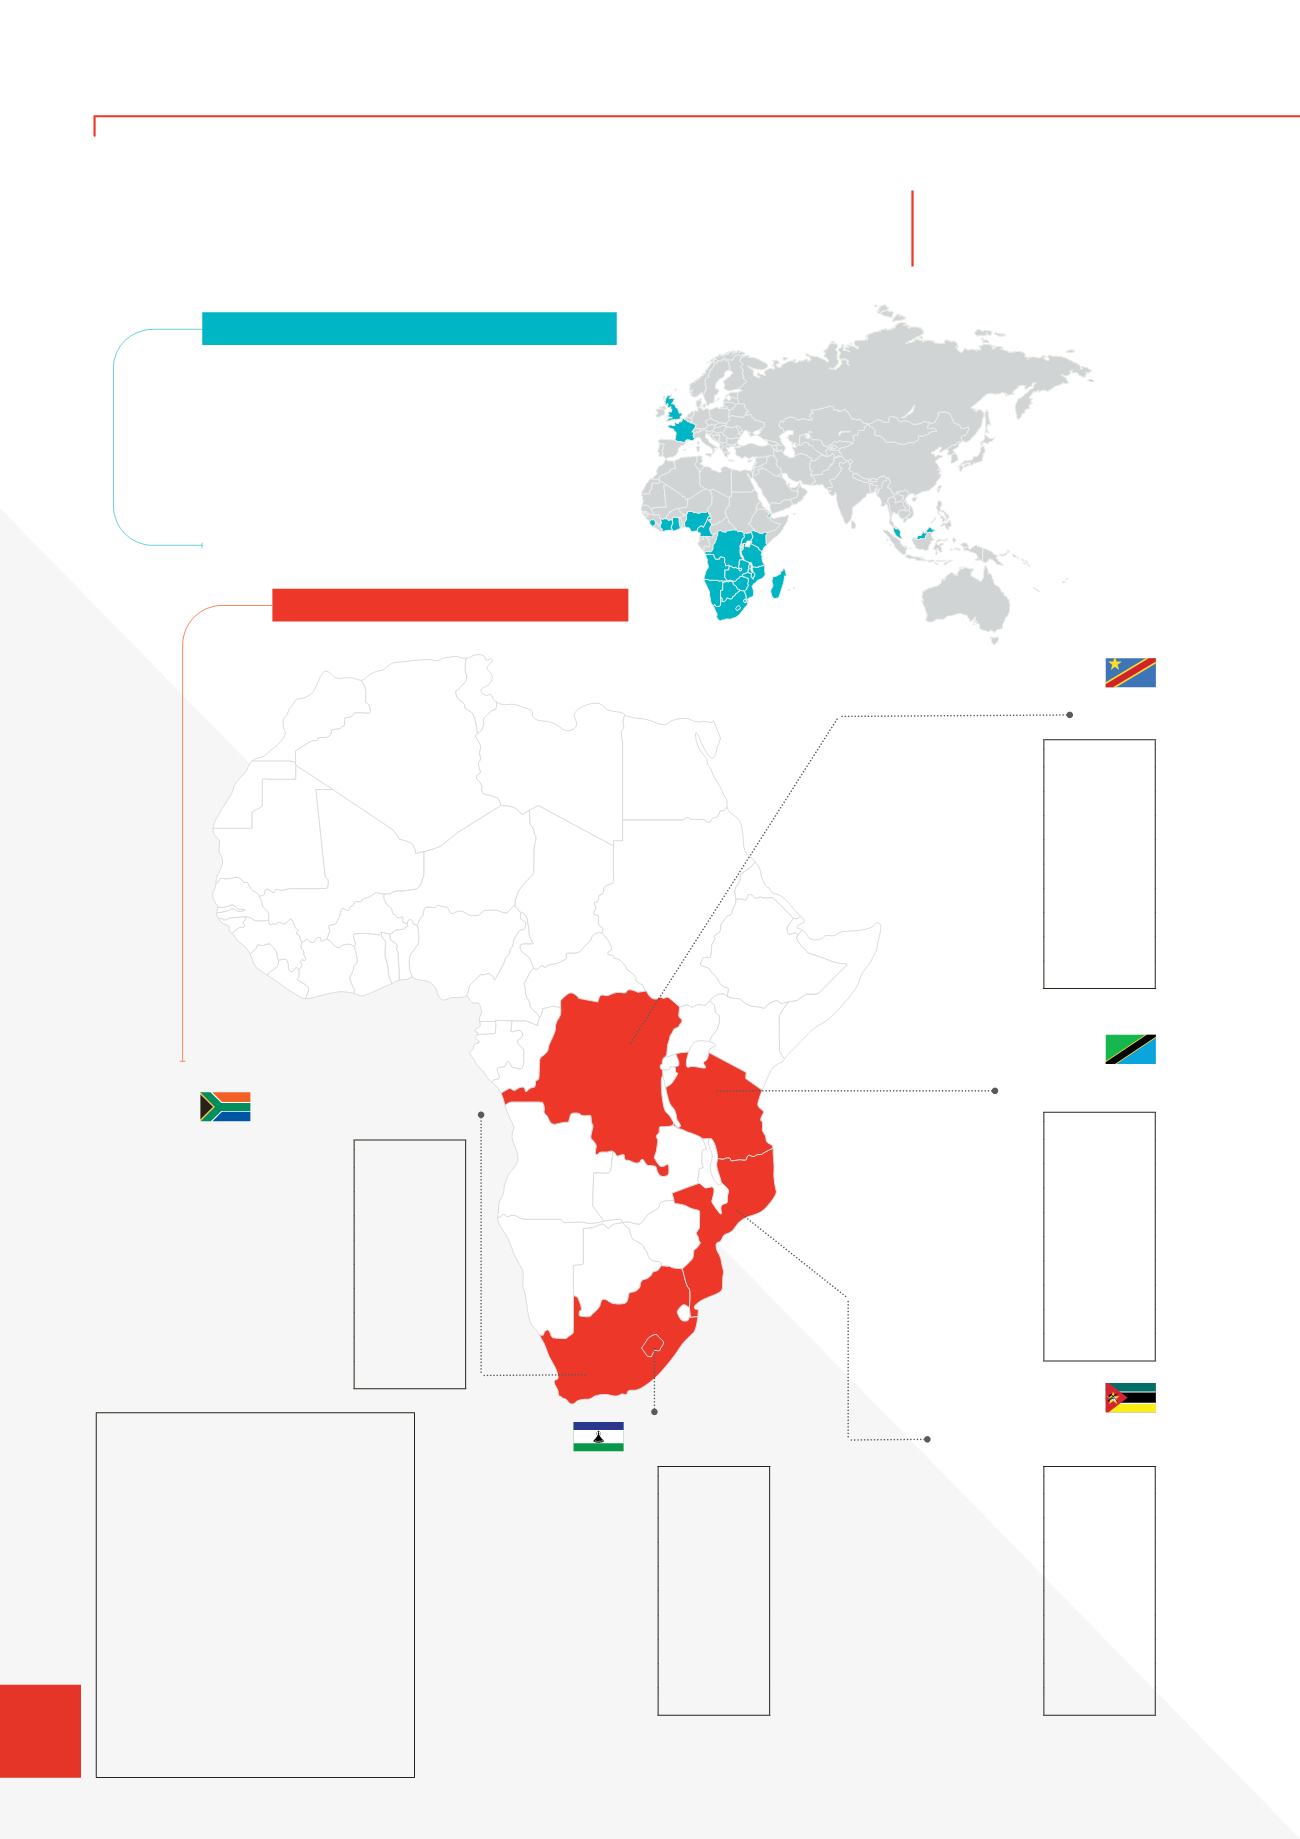
Where we operate
Vodacom Business Africa
Angola
Botswana
Cameroon
Democratic
Republic of
Congo (DRC)
Côte d’Ivoire
Djibouti
Equatorial Guinea
France
Ghana
Kenya
Lesotho
Liberia
Madagascar
Malawi
Malaysia
Mauritius
Mozambique
Namibia
Nigeria
Rwanda
Senegal
Sierra Leone
Singapore
South Africa
Swaziland
Tanzania
Uganda
United Kingdom
Zambia
Zimbabwe
Ownership
93.75%
1
Population
2
(estimate):
55 million
GDP growth estimate
2
2016:
0.4%
Active customers:
34.2 million
Unique subscriber penetration
3
:
59.9%
ARPU
4
:
R112
Licence expiry period:
2029
Market share
6
:
50.4%
^
Coverage
7
:
99.9%
NPS:
1st
Ownership
80%
Population
2
(estimate):
2 million
GDP growth estimate
2
2016:
2.0%
Active customers:
1.4 million
Unique subscriber penetration
3
:
50.5%
ARPU
4
:
LSL62
Licence expiry period:
2036
Market share
6
:
77.4%
^
Coverage
7
:
96.0%
NPS:
1st
Ownership
85%
Population
2
(estimate):
29 million
GDP growth estimate
2
2016:
4.2%
Active customers:
4.8 million
Unique subscriber penetration
3
:
37.9%
ARPU
4
:
MZN169
Licence expiry period
5
:
2018/2026
Market share
6
:
43.7%
^
Coverage
7
:
49.6%
NPS:
1st
Ownership
82.2%
Population
2
(estimate):
55 million
GDP growth estimate
2
2016:
6.5%
Active customers:
12.4 million
Unique subscriber penetration
3
:
49.9%
ARPU
4
:
TZS5 972
Licence expiry period:
2031
Market share
6
:
39.3%
^
Coverage
7
:
87.3%
NPS:
2nd
Ownership
51%
Population
2
(estimate):
71 million
GDP growth estimate
2
2016:
5.0%
Active customers:
8.5 million
Unique subscriber penetration
3
:
27.3%
ARPU
4
:
USD3.0
Licence expiry period
5
:
2028/2032
Market share
6
:
35.0%
^
Coverage
7
:
50.6%
NPS:
4th
Notes:
1. 6.25% held indirectly through structured entities
which are consolidated in terms of
IFRS 10: Consolidated Financial Statements
as part of the BBBEE transaction.
2. Bureau for Economic Research (BER) and the
Economist Intelligence Unit (EIU). Gross
Domestic Profit (GDP) relates to real GDP growth.
3. WCIS (Ovum), GSM Intelligence, StatsSA –
SA population and EIU (population for other
African markets).
4. Total average revenue per user (ARPU) is
calculated by dividing the average monthly
service revenue by the average monthly
active customers during the period.
5. 2018/2028 relates to the 2G licence and
2026/2032 relates to the 3G licence.
6. Service revenue market share.
7. 2G coverage.
^ These items were the subject of the limited
assurance engagement performed by EY.
Points of presence for mobile operations
South Africa
DRC
Lesotho
Mozambique
Tanzania