


 11 / 102

07
Our business
Operating context
Delivering on our strategy
Our governance structure
Administration
Howwe create value
Our profit formula
We generate profit by efficiently utilising mobile fixed connectivity, cloud and hosting and fixed-line assets to provide
our consumer and enterprise customers with valued voice, data, messaging and related services. Our competitive
differentiation lies in the quality of our network, the nature of our products and services, the ability to use data
analytics to extract value, the extent of our regional footprint, the quality of the relationships we have with key
stakeholders, and our proven ability to manage our cost base.
Our revenues
Most of our revenue comes from selling mobile data, voice and
messaging services to individual consumers, with the balance
coming from the sale of these mobile services, coupled with
connectivity, cloud and hosting and network provision services to
our enterprise customers. The decline in mobile voice revenue
has been more than offset by significant growth in enterprise and
data revenue, fuelled by the increased uptake of smart devices,
improved network coverage, more affordable data bundles and
enhanced digital content.
41.7% of our customer revenue is generated from customers
who pay on a monthly basis via fixed-term contracts
(contract), while the balance top up their airtime on a
prepaid basis.
70.6% of mobile contract revenue is in-bundle, reducing
exposure to the risk of discretionary spend in out-of-bundle
usage.
Key
revenue
differentiators
•
Rated first in network quality in three of our five countries of
operation.
•
A diverse and widespread distribution network across all our
operations.
•
Industry-leading customer value management (CVM)
systems, people and processes.
•
Personalised offers to customers to better fit their needs and
behaviours.
•
Leveraging off global enterprise relationships for pan-African
service delivery.
•
Best-in-class customer service support systems.
•
Ability to leverage off our relationship with Vodafone, driving
global best practice in performance.
Our costs
We have a strong track record of optimising expenses and
converting revenue into cash flow. We have achieved significant
results in limiting cost growth through our ‘Fit for growth’
programme, managing staff expenses, publicity spend and other
operating expenses. This has been enabled through an improved
culture of cost containment across the business. Our resulting
strong cash flow helps us to maintain a high level of capital
re-investment, primarily in our network infrastructure to maintain
our leading position in network coverage, call quality and data
speed in all our markets. We have also focused capital spend
on our new billing system as we transition from a predominately
mobile company to a unified communications provider.
In addition to investing in the future prosperity of the business,
cash generated from our business allows us to maintain our
generous shareholder returns, with our dividend policy of
paying out at least 90% of HEPS.
Key
cost
differentiators
•
Leveraging global best practice on cost optimisation through
our Group-wide ‘Fit for growth’ programme where we benefit
from and share best practice with Vodafone.
•
Benefiting from the purchasing power of Vodafone
Procurement Company.
•
Consistent investment in network, delivering continuous
improvement in operating costs through more efficient
technologies and network innovation.
•
Robust governance processes for approving investments and
reviewing product, cost and investment decisions.
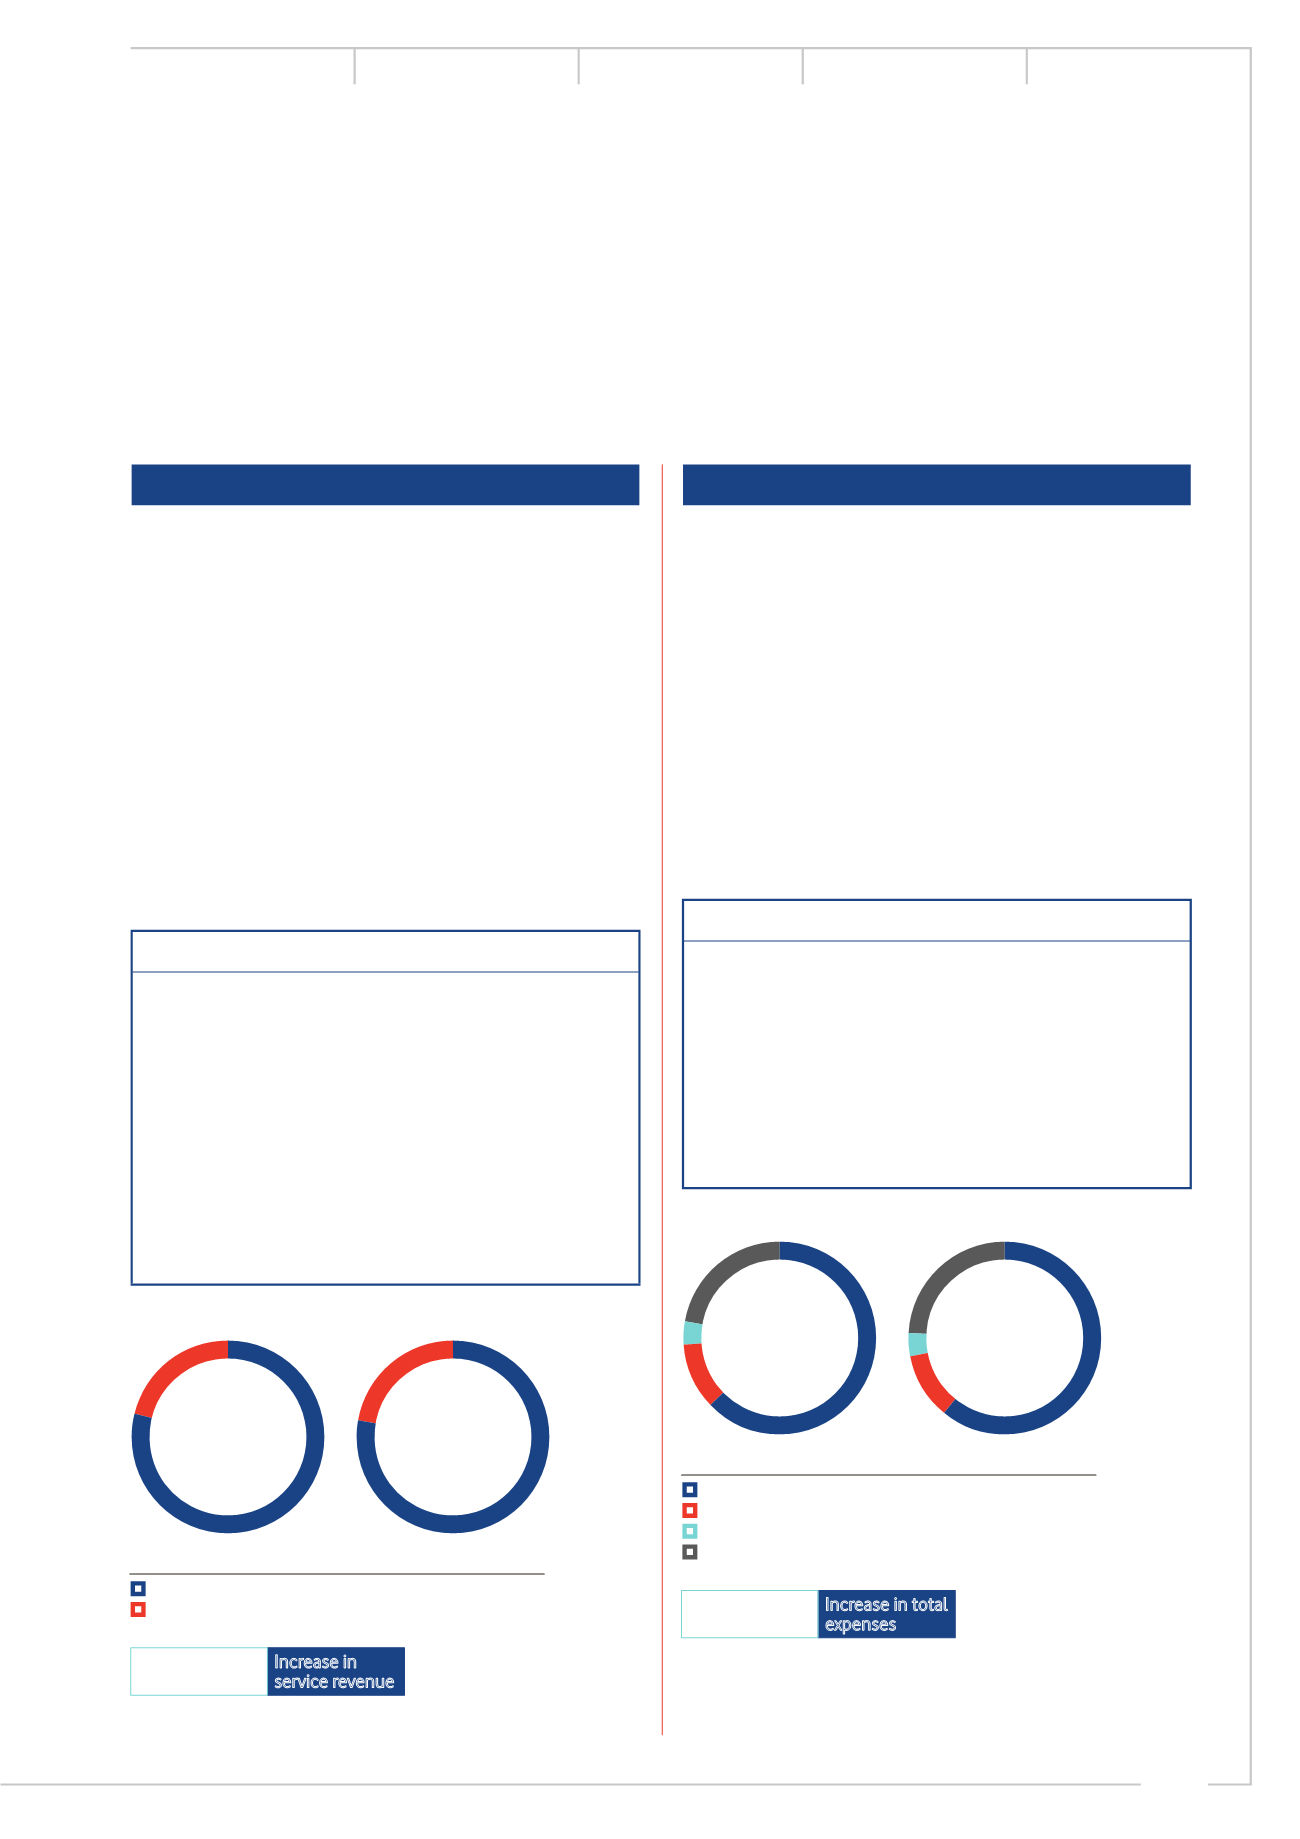
Increase in
service revenue
+2.3%
Increase in total
expenses
+0.3%
%
2016
2017
■
Consumer service revenue
79
78
■
Enterprise service revenue
21
22^
2016
Group service revenue composition
(%)
2017
%
2016
2017
■
Direct expenses
63
61
■
Staff expenses
11
11
■
Publicity expenses
4
4
■
Other opex
22
24
2016
Group total expenses composition
(%)
2017
^ These items were the subject of the limited assurance engagement
performed by KPMG.