


 8 / 102

What we offer
We have over 66.8 million individual
customers using our wide range of
products and services, all of which are
available on either contract, top-up or
prepaid. Our consumer products and
services include voice, messaging and
data across mobile and fixed networks,
as well as financial services and
entertainment offerings. We also
provide various communication
solutions to our enterprise customers in
the public sector, and amongst large,
medium and small enterprises. These
include connectivity and unified
communication services, cloud and
hosting, managed mobility and
data security.
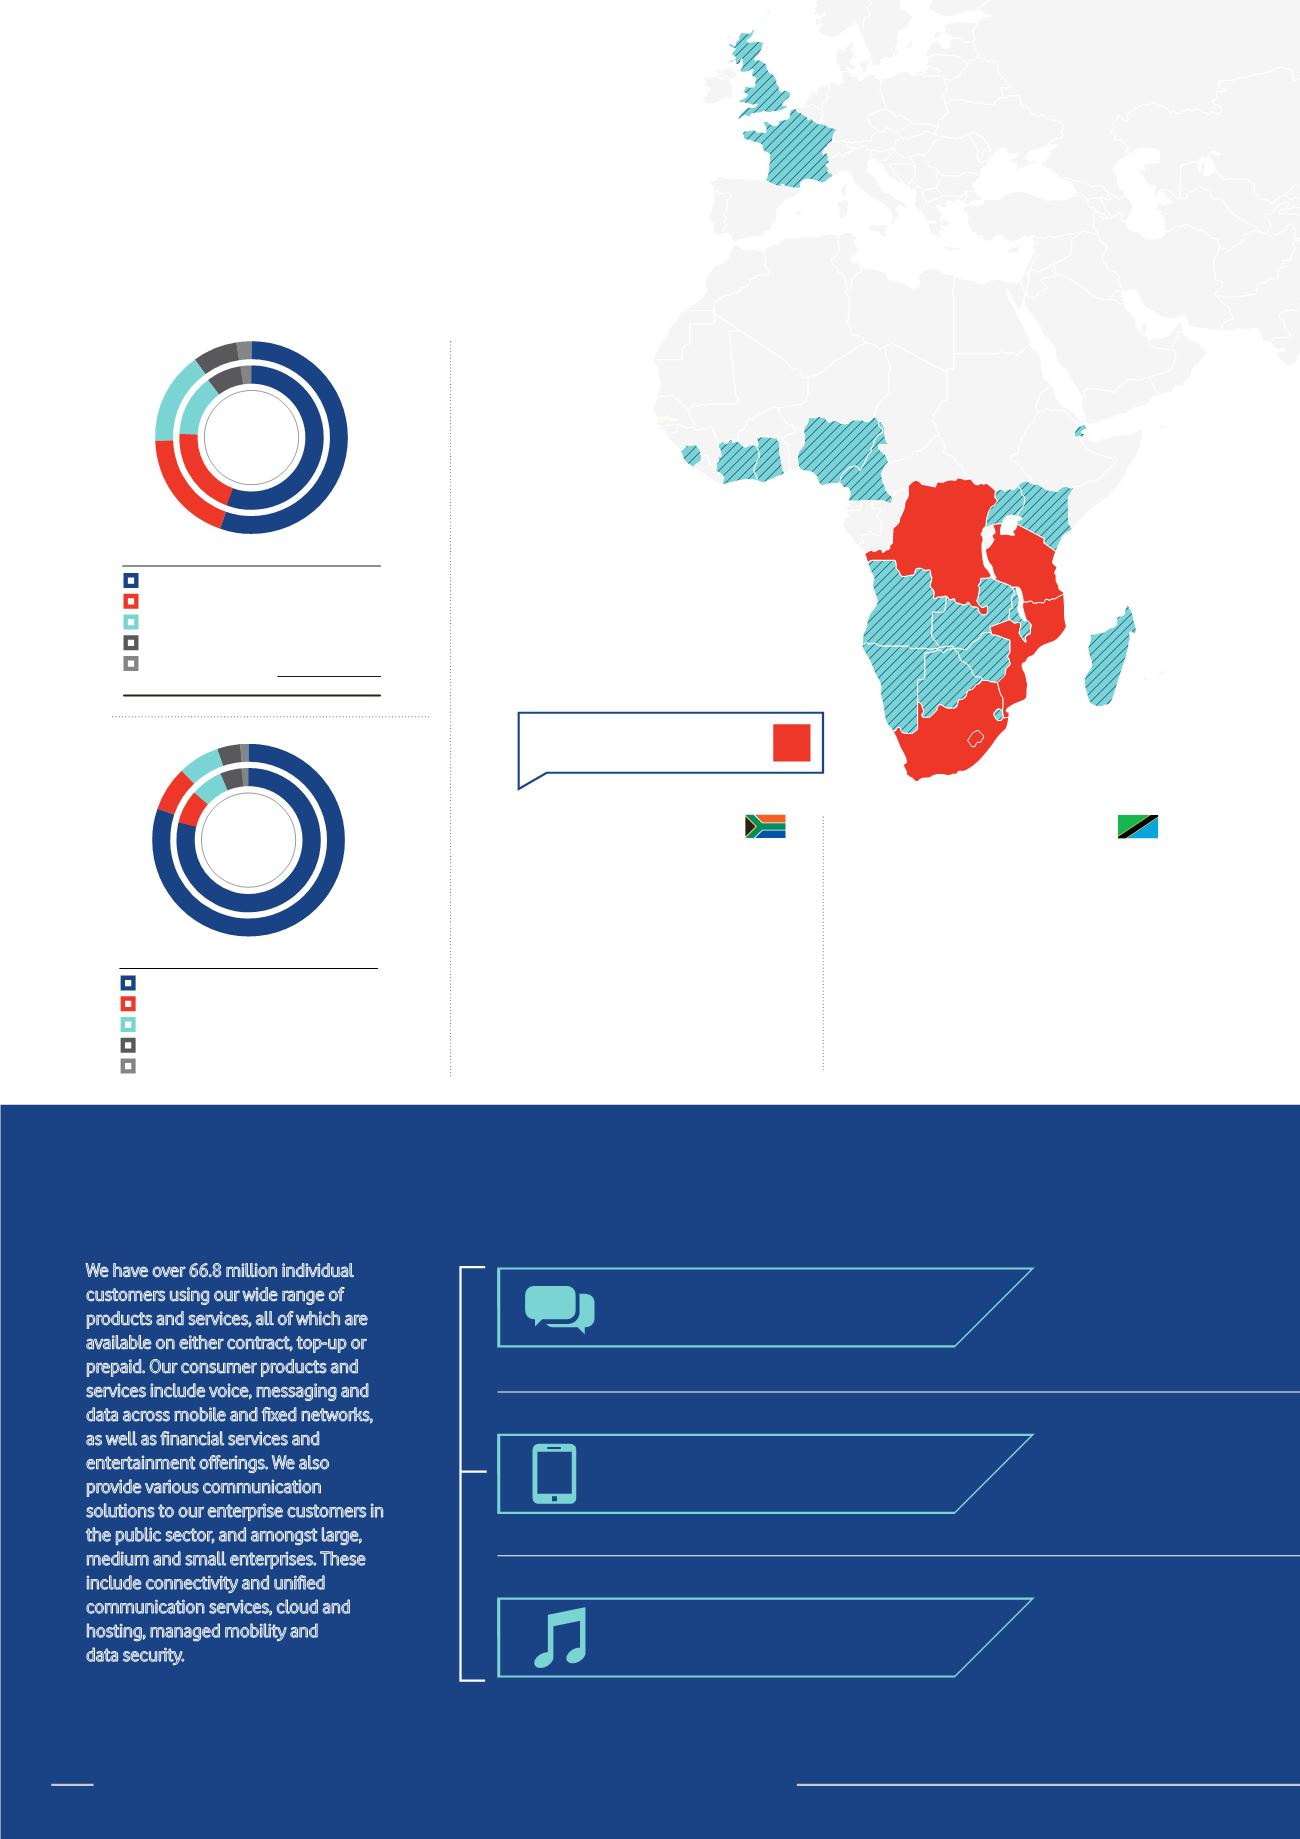
Where we
operate
Our products and services
Consumer products
Points of presence (PoPs)
for mobile operations
South Africa
Ownership
93.75%
1
Population
2
(estimate):
55 million
GDP growth estimate
2
:
0.3%
Customers:
37.1 million
ARPU
3
(local currency per month):
R111
Licence expiry period:
2029
Service revenue market share:
51.0%^
Coverage
5
:
99.9%
NPS:
1st
PoPs – formal:
10 048
PoPs – informal:
55 249
Tanzania
Ownership
82.15%
Population
2
(estimate):
55 million
GDP growth estimate
2
:
6.8%
Customers:
12.7 million
ARPU
3
(local currency per month):
TZS6 003
Licence expiry period:
2031
Customer market share:
30.9%
Coverage
5
:
88.0%
NPS:
3rd
PoPs – formal:
100 810
PoPs – informal:
14 522
Enterprise
Consumer services
million
2017
2016
■
South Africa
37.1
34.2
■
Tanzania
12.7
12.4
■
DRC
10.4
8.5
■
Mozambique
5.1
4.8
■
Lesotho
1.5
1.4
Total
66.8
61.3
Customers
2
0
1
6
2
0
1
7
million
2017
2016
■
South Africa (R)
64 729
62 279
■
Tanzania (TZS)
933 292
923 347
■
DRC (US$)
407 413
429 605
■
Mozambique (MZN)
14 641
11 896
■
Lesotho (LSL)
1 116
1 027
Revenue
2
0
1
6
2
0
1
7
04
Vodacom Group Limited
Integrated report for the year ended 31 March 2017