Customers are based on the total number of mobile customers using any service during the last three months. This includes
customers paying a monthly fee that entitles them to use the service even if they do not actually use the service and those
customers who are active while roaming.
Data customers have been restated to exclude customers with free allocated data bundles not used. Data customers are based
on the number of unique users generating billable data traffic during the month. Also included are users on integrated tariff
plans, or who have access to corporate APNs, and users who have been allocated a revenue generating data bundle during the
month. A user is defined as being active if they are paying a contractual monthly fee for this service or have used the service
during the reported month.
Internet of Things (IoT) connections, previously machine-to-machine, is the remote wireless interchange between two or more
predefined devices or a central station without direct relationship with an end customer, in order to support a specific business
process or product.
Minutes of use (MOU) per month is calculated by dividing the average monthly minutes (traffic) during the period by the
average monthly active customers during the period.
Total ARPU is calculated by dividing the average monthly service revenue by the average monthly customers during the
period. Prepaid and contract ARPU only include service revenue generated from Vodacom mobile customers.
^ These items were the subject of the limited assurance engagement performed by KPMG.
¥ Prior year service revenue market share has been restated for updated competitor information.
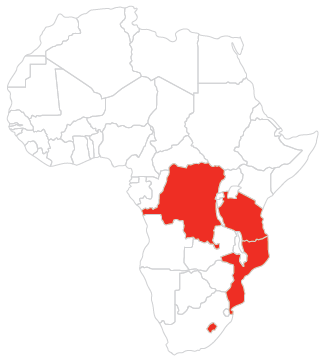
Service revenue declined 5.6% (up 2.2%*)
to R16 775 million, impacted by exchange rate
volatility and the anticipated effect of the
disconnection of customers, most notably in the
prior year, in compliance with customer registration
requirements in the DRC, Mozambique and Tanzania.
Short-term pressure remains, with signs of
improvement in Tanzania, very strong execution in
Mozambique and Lesotho, but a challenging macro
environment in the DRC. We have introduced
‘Just 4 You’ personalised offers across all our
operations and take up is progressing well. M-Pesa
continues to be a key area of growth.
Customers increased 9.3% to 29.7 million as
the International operations have returned to
positive net additions of 2.5 million in the year. We
continue to improve our customer registration
processes as we work closely with regulators to
ensure full compliance in all our operations.
Data revenue grew 2.3%
(9.4%*) to R4 113 million driven by
a 29.3% increase in data customers
to 13.0 million, reflecting strong
demand for mobile data services in
all our markets, offset by strong
pricing competition, mainly in
Tanzania and the DRC. We continue
to focus on our commercial and
network offering to drive data
growth, ensuring customers
have access to better low-cost
smart devices, especially
Vodacom-branded devices,
increasing data network speeds
and driving the adoption of data
bundles. Improving monetisation
of the substantial growth
opportunity in data in all
operations is a key priority for
the next financial year.
M-Pesa revenue increased 19.4% to R1.9 billion, fuelled by
expansion in the distribution channels and expansion of the
products and services on offer. We added 3.7 million customers,
increasing the number of customers to 12.9 million1. Tanzania
launched an M-Pesa app for smartphones that has unique
experiences such as QR code assisted payments, easier access to
contacts, predefined amounts and integrates with the merchant
payment platform. Mozambique has made significant progress in
the year; 2.5 million customers representing 48% of its customer
base are now using the M-Pesa service while Tanzania leads at
63% penetration of its customer base. The DRC has reached
over two million customers as they focused on improving
distribution. We have implemented a new M-Pesa platform in all
operations except Lesotho with enhanced technology which has
significantly improved stability, resulting in increased trust with
customers which is a key attribute for success. The system
continues to grow from its roots of person to person transfers,
now also incorporating a complete merchant payment system,
bill payments, a salary payment system, as well as savings
and loans products for customers. In Tanzania alone, we now
transact US$1 billion in value each month.
1.
Number of unique customers who have generated revenue related to M-Pesa in the past 90 days; of these 10.0 million have been active in the past 30 days.
EBITDA declined 15.6%, normalised declined
8.6%* to R4 545 million and the EBITDA margin
contracted by 3.1ppts to 26.2%. A number of
actions to mitigate the impact of the slowed
revenue growth in the year helped to offset the
impact on margins. These included sales margin
improvement through the promotion of own
channels such as M-Pesa for recharge,
restructuring to drive improved efficiencies and
continued savings in network operating expenses
through our ‘Fit for growth’ savings programme.
Capital expenditure of R2 833 million
represented 16.3% of revenue. We continue to
invest significantly in all our markets to
strengthen network and service differentiation
and to support data growth and wider voice
coverage. We added 284 4G sites, 888 3G sites
and 536 2G sites since March 2016.
Tanzania
Year ended 31 March
2017
2016
Revenue (TZSm)
933 292
923 347
EBIT (TZSm)
97 260
107 200
Customers1 (thousand)
12 653
12 375
Data customers2 (thousand)
6 463
5 415
MOU per month4
157
124
Total ARPU5 (TZS per month)
6 003
5 972
Number of employees
525
546
NPS (position relative to competitors)
3rd
2nd
Customer market share#1
30.9%
31.9%¥
Customers are based on the total number of mobile customers using any service during the last three months. This includes
customers paying a monthly fee that entitles them to use the service even if they do not actually use the service and those
customers who are active while roaming.
Data customers have been restated to exclude customers with free allocated data bundles not used. Data customers are based
on the number of unique users generating billable data traffic during the month. Also included are users on integrated tariff
plans, or who have access to corporate APNs, and users who have been allocated a revenue generating data bundle during the
month. A user is defined as being active if they are paying a contractual monthly fee for this service or have used the service
during the reported month.
Internet of Things (IoT) connections, previously machine-to-machine, is the remote wireless interchange between two or more
predefined devices or a central station without direct relationship with an end customer, in order to support a specific business
process or product.
Minutes of use (MOU) per month is calculated by dividing the average monthly minutes (traffic) during the period by the
average monthly active customers during the period.
Total ARPU is calculated by dividing the average monthly service revenue by the average monthly customers during the
period. Prepaid and contract ARPU only include service revenue generated from Vodacom mobile customers.
^ These items were the subject of the limited assurance engagement performed by KPMG.
¥ Prior year service revenue market share has been restated for updated competitor information.
Solid progress in most of our strategic priority areas enabled us to
deliver a stronger second half performance, despite a highly
competitive environment. In particular, our continued investments in
data, M-Pesa and enterprise paid dividends by lifting customer and
revenue growth in the second half of the year. Our investments to
date have resulted in expanded coverage and a superior data
network experience, placing Vodacom at the forefront of securing
growth in mobile data. During the year, we launched high-speed
4G coverage across Dar es Salaam and produced impressive average
download speeds which are over 60% faster than our next-best
competitor. We continue to explore opportunities for spectrum
acquisition which will enable us to rollout 4G into other regions.
In addition, we made data services more accessible by introducing
affordably priced smartphones and attractive data propositions.
This largely contributed to the 19.4% increase in active data
customers who now make up 51.1% of our active customer base.
M-Pesa consistently delivered strong growth throughout the year
despite the negative impact of excise duty increases imposed in
July 2016. The continued expansion of our mobile money ecosystem
helped fuel the 13.3% or 936 thousand increase in M-Pesa
customers. M-Pesa revenue grew 11.2% to TZS249.6 billion, and now
accounts for 27.3% of service revenue, up from 24.5% last year.
EBIT declined by 9.3%. The impact from slower revenue growth
and greater network operating costs was limited by our vigorous
focus on cost containment through our ‘Fit for growth’ programme,
which improved operating leverage during the period, protecting
EBIT margin from further compression.
Under Section 26 of the Electronic and Postal Communications
Act, 2010 (as amended by the Finance Act, 2016), licensed
telecommunications operators are required to issue 25% of their
share capital through an initial public offering (IPO) to Tanzanians
and thereafter list the said shares on the Dar es Salaam stock
exchange (DSE). Vodacom Tanzania opened its IPO on 9 March 2017
and the offer period closed on 11 May 2017. The listing of shares is
expected to take place in June 2017, subject to approval by the
Capital Markets and Securities Authority (CMSA) and the DSE.
Looking ahead, we aim to maintain the encouraging momentum of
the second half of the past year by continuing to focus investments
across our key strategic drivers – data, M-Pesa, and enterprise –
which are expected to yield strong growth. We will remain resolute
in our quest to further enhance customer experience through both
service levels and our network advantage while being cognisant of
containing costs through our ‘Fit for growth’ initiative.
DRC
Year ended 31 March
2017
2016
Revenue (US$’000)
407 413
429 605
EBIT (US$’000)
12 664
40 633
Customers1 (thousand)
10 388
8 527
Data customers2 (thousand)
3 705
1 996
MOU per month4
49
39
Total ARPU5 (US$ per month)
4
3
Number of employees
617
613
NPS (position relative to competitors)
1st
4th
Customer market share #1
38.9%
37.1%¥
Customers are based on the total number of mobile customers using any service during the last three months. This includes
customers paying a monthly fee that entitles them to use the service even if they do not actually use the service and those
customers who are active while roaming.
Data customers have been restated to exclude customers with free allocated data bundles not used. Data customers are based
on the number of unique users generating billable data traffic during the month. Also included are users on integrated tariff
plans, or who have access to corporate APNs, and users who have been allocated a revenue generating data bundle during the
month. A user is defined as being active if they are paying a contractual monthly fee for this service or have used the service
during the reported month.
Internet of Things (IoT) connections, previously machine-to-machine, is the remote wireless interchange between two or more
predefined devices or a central station without direct relationship with an end customer, in order to support a specific business
process or product.
Minutes of use (MOU) per month is calculated by dividing the average monthly minutes (traffic) during the period by the
average monthly active customers during the period.
Total ARPU is calculated by dividing the average monthly service revenue by the average monthly customers during the
period. Prepaid and contract ARPU only include service revenue generated from Vodacom mobile customers.
^ These items were the subject of the limited assurance engagement performed by KPMG.
¥ Prior year service revenue market share has been restated for updated competitor information.
Vodacom DRC rebranded from blue to red and celebrated 15 years
in the DRC. We also improved our NPS position to first from fourth
place last year.
Following the loss of close to three million customers (25% of the
customer base) in the prior year due to registration requirements,
this was always going to be a tough year for us, as we worked to
recover these customers during the year. Political instability and a
deteriorating macroeconomic environment created a tough
operating environment. The Congolese franc depreciated 45%
against the US dollar and GDP growth slowed to an estimated
15-year low of 2.5%
Despite these negative impacts we continued to deliver on our
strategic objectives. This was backed by further capital investment
in the network, billing services and IT, which resulted in us
improving to first position in our customer satisfaction measure,
NPS. Revenue declined by 5.2% due to lower gross connections
resulting from compliance with the customer registration
requirements, an economic slowdown and further regulatory
pressures.
Data customers increased 85.6% and data traffic increased 46.7%,
underpinned by better device penetration. M-Pesa revenue growth
of 66.9% was driven by an additional 1.2 million customers,
resulting from our strategic focus on distribution. The EBIT decline
was driven by various factors, including lower revenue, regulatory
fee increases and customer-related acquisition costs. This was
partially offset by the implementation of Vodacom’s ‘Fit for
growth’ cost-savings initiatives, including headcount efficiencies,
contract renegotiations and energy rationalisation.
The customer base increased by 21.8%, adding 1.9 million
customers, close to recovering the number of customers
disconnected in the prior year. This has largely been achieved
through the deployment of the customer registration app and
increased points of registration across the country.
In the year ahead, we will continue to execute on the rebranding
nationwide, driving customer value management by reinforcing
offerings such as ‘Just 4 You’, introducing a franchise model to
increase our retail footprint, and improving key service level
agreements in line with our CARE initiatives.
Mozambique
Year ended 31 March
2017
2016
Revenue (MZNm)
14 641
11 896
EBIT (MZNm)
2 568
2 065
Customers1 (thousand)
5 146
4 826
Data customers2 (thousand)
2 280
2 112
MOU per month4
121
104
Total ARPU5 (MZN per month)
216
169
Number of employees
485
466
NPS (position relative to competitors)
2nd
1st
Customer market share #1
47.6%
45.8%¥
Customers are based on the total number of mobile customers using any service during the last three months. This includes
customers paying a monthly fee that entitles them to use the service even if they do not actually use the service and those
customers who are active while roaming.
Data customers have been restated to exclude customers with free allocated data bundles not used. Data customers are based
on the number of unique users generating billable data traffic during the month. Also included are users on integrated tariff
plans, or who have access to corporate APNs, and users who have been allocated a revenue generating data bundle during the
month. A user is defined as being active if they are paying a contractual monthly fee for this service or have used the service
during the reported month.
Internet of Things (IoT) connections, previously machine-to-machine, is the remote wireless interchange between two or more
predefined devices or a central station without direct relationship with an end customer, in order to support a specific business
process or product.
Minutes of use (MOU) per month is calculated by dividing the average monthly minutes (traffic) during the period by the
average monthly active customers during the period.
Total ARPU is calculated by dividing the average monthly service revenue by the average monthly customers during the
period. Prepaid and contract ARPU only include service revenue generated from Vodacom mobile customers.
^ These items were the subject of the limited assurance engagement performed by KPMG.
¥ Prior year service revenue market share has been restated for updated competitor information.
Vodacom Mozambique delivered a solid performance this
year maintaining double-digit revenue growth of 23.1% to
MZN14.6 billion, despite challenging economic conditions that
resulted in the metical depreciating 55.8% to the rand. We also felt
the impact of customer disconnections to comply with customer
registration requirements.
Voice revenue continued to grow strongly, up 18.6%. This was
driven mainly by higher ARPU, as a result of increased usage and
the 6.6% growth in customers. Significantly, data revenue has
continued its upward momentum, increasing 38.5%, reflecting the
increased demand for data services and the success of sales of
Vodacom-branded smartphones; data revenue now contributes
23.0% to service revenue. Demand for our financial services
offering continues to grow, with M-Pesa revenue increasing more
than threefold. We now have 2.5 million M-Pesa customers who
are benefiting from the migration to the new M-Pesa platform,
which enables us to offer more services seamlessly.
EBIT growth was due to the strong revenue growth, but has been
hampered by higher operating expenditure as a result of the
foreign exchange movement. We have managed to reduce the
impact on EBIT by delivering cost savings through the ‘Fit for
growth’ programme, resulting in lower network costs and revised
commission structures.
Our main focus for the year ahead is to reclaim our NPS leadership
through network enhancement and to improve customer
experience by delivering on our customer CARE initiatives.
We will accelerate growth in data by increasing active data
customers and increase smartphone penetration by moving
subsidies to low-cost smartphones. We will grow the enterprise
business through indirect channel acquisition of customers and
by providing additional offerings to corporates on the Internet of
Things, and we will continue to deliver EBIT growth through our
‘Fit for growth’ initiatives.
The Regulator intends to launch the spectrum auction during
2017. We await the publication of the resolution with the terms
and conditions of the auction. We are also exploring alternatives to
obtain additional spectrum.
The Regulator has applied a 50% reduction in mobile termination
rates (MTRs) from MT0.86 to MT0.43 per minute from
1 January 2017 until the end of April 2017, and is expected
to continue decreasing MTRs.
Lesotho
Year ended 31 March
2017
2016
Revenue (LSLm)
1 116
1 027
EBIT (LSLm)
426
383
Customers1 (thousand)
1 468
1 399
Data customers2 (thousand)
549
532
MOU per month4
82
75
Total ARPU5 (LSL per month)
61
62
Number of employees
207
202
NPS (position relative to competitors)
1st
1st
Customer market share #1
90.9%
87.7%¥
Customers are based on the total number of mobile customers using any service during the last three months. This includes
customers paying a monthly fee that entitles them to use the service even if they do not actually use the service and those
customers who are active while roaming.
Data customers have been restated to exclude customers with free allocated data bundles not used. Data customers are based
on the number of unique users generating billable data traffic during the month. Also included are users on integrated tariff
plans, or who have access to corporate APNs, and users who have been allocated a revenue generating data bundle during the
month. A user is defined as being active if they are paying a contractual monthly fee for this service or have used the service
during the reported month.
Internet of Things (IoT) connections, previously machine-to-machine, is the remote wireless interchange between two or more
predefined devices or a central station without direct relationship with an end customer, in order to support a specific business
process or product.
Minutes of use (MOU) per month is calculated by dividing the average monthly minutes (traffic) during the period by the
average monthly active customers during the period.
Total ARPU is calculated by dividing the average monthly service revenue by the average monthly customers during the
period. Prepaid and contract ARPU only include service revenue generated from Vodacom mobile customers.
^ These items were the subject of the limited assurance engagement performed by KPMG.
¥ Prior year service revenue market share has been restated for updated competitor information.
Vodacom Lesotho continued to grow strongly this year.
Revenue increased 8.7% and we delivered an even stronger EBIT
growth of 11.2%. The main contributor to revenue growth has
been the increase in data revenue, which now contributes 24.4%
of service revenue. Our bundle strategy helped us achieve a 34.2%
decline in the average price per MB while delivering overall data
revenue growth of 38.2%. We continue to drive smartphone
penetration through the sale of Vodacom-branded devices at
affordable price points.
We have seen significant growth in M-Pesa revenue, supported
by the number of M-Pesa customers increasing 76.8%. This growth
was the result of expanding the M-Pesa ecosystem by increasing
‘pay bill’ transactions, airtime purchases and bulk payments, such
as salary payments, through M-Pesa, and enhancing the stability
of the M-Pesa platform.
Our strong EBIT growth has been possible through delivering
on our ‘Fit for growth’ initiatives, mainly by increasing sales
(airtime and connections) through direct channels such as
M-Pesa and retail stores.
Through our CARE initiatives, we continue to see improvements in
call centre and retail KPIs, with service levels consistently reaching
above 80%. We ended the year with a low 0.38% dropped-call rate.
These initiatives assisted the recovery in NPS with a 5ppt gap to
the competitor.
We continued to invest in the network, increasing 3G and 4G sites,
as well as our fibre rollout. Significant capital was invested in
developing our IT systems to build capabilities to enhance our
customer value management propositions.
Looking to the year ahead, data monetisation remains a key
priority as we aim to increase smartphone penetration through
subsidies directed towards 3G/4G devices.
We are optimistic that our ability to offer contextually relevant offers
through our ‘Just 4 You’ platform launched in November 2016, we
will significantly improve customer experiences.
M-Pesa remains a key growth area. We have obtained Central Bank
approval to implement a hosted M-Pesa platform with Vodacom
South Africa. This will enable a deeper focus on customer value
management with new technology and people capabilities
built in.