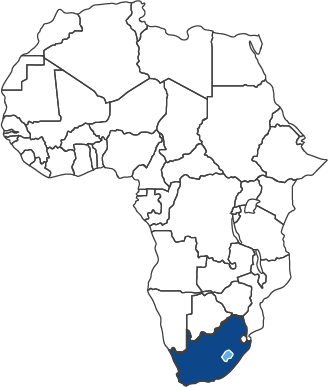
Customers are based on the total number of mobile customers using any service during the last three months. This includes
customers paying a monthly fee that entitles them to use the service even if they do not actually use the service and those
customers who are active while roaming.
Data customers have been restated to exclude customers with free allocated data bundles not used. Data customers are based
on the number of unique users generating billable data traffic during the month. Also included are users on integrated tariff
plans, or who have access to corporate APNs, and users who have been allocated a revenue generating data bundle during the
month. A user is defined as being active if they are paying a contractual monthly fee for this service or have used the service
during the reported month.
Internet of Things (IoT) connections, previously machine-to-machine, is the remote wireless interchange between two or more
predefined devices or a central station without direct relationship with an end customer, in order to support a specific business
process or product.
Minutes of use (MOU) per month is calculated by dividing the average monthly minutes (traffic) during the period by the
average monthly active customers during the period.
Total ARPU is calculated by dividing the average monthly service revenue by the average monthly customers during the
period. Prepaid and contract ARPU only include service revenue generated from Vodacom mobile customers.
^ These items were the subject of the limited assurance engagement performed by KPMG.
¥ Prior year service revenue market share has been restated for updated competitor information.
Service revenue increased 5.6% to R52 071 million
driven by strong customer additions, with good progress on
data and enterprise services. Revenue grew by 3.9% to
R64 729 million, hampered by the equipment revenue
decline of 4.0%. This was mainly due to slightly lower
device sales, which was impacted by the weakening of the
rand against the US dollar and Euro for most of the year.
Customers increased by 8.6% to 37.1 million, with
3.0 million customer net additions in the year, as our
segmentation and bundle strategy continued to attract
new customers. Prepaid customers reached
32.0 million, up 9.3%, driven by the success of our improved
value propositions through ‘Just 4 You’ offers, the
successful launch of our youth (NXT LVL) proposition and a
highly engaging summer promotion. We added 218 000
contract customers during the year with improved
loyalty leading to reduced contract churn of 4.2%, while
increasing contract ARPU by 2.8% to R408. Our bundle
strategy, designed to make communication more
affordable, continues to progress well and we sold a total of
1.5 billion bundles, up, 34.1% in the period. Of these, one
billion were voice bundles. This enabled us to reduce our
effective price per minute by 14.3% to the benefit of
customers. The success of the personalised voice bundle
strategy through our ‘Just 4 You’ platform has resulted in a
slower voice revenue decline of 3.7%.
Data revenue grew 19.7% to R20 696 million; now
comprises 39.7% of service revenue. As the strong demand
for data continues, underlying drivers of growth remain
strong with data customers up 8.3% to 19.5 million and
data traffic up 43.2%. This was enabled through growing our
data network coverage and capacity, as well as focusing our
device strategy on increasing 3G and 4G device uptake. 4G
customers on our network increased 86.7% to 5.1 million,
while the average monthly data usage on smartphones
increased 25.0% to 560MB. Our data bundle sales grew
by 44.8% to 495 million resulting in the reduction in the
effective price per MB by 16.0% thereby continuing to
give more value to our customers. Our focus in the year
ahead will be to transform data pricing to the benefit of
customers, by reducing customer exposure to higher
out-of-bundle rates.
Enterprise showed continued strong revenue growth
of 12.7% (of which 2.8ppts relate to the impact of Autopage
customer buy backs in the prior year) from customer win
backs, and now contributes 24.3% (2016: 22.8%) of service
revenue. Mobile enterprise customer revenue grew 14.2%
(of which 4.5ppts relates to the impact of Autopage
customer buy-backs in the prior year) to R7 884 million.
We have secured South Africa’s national and provincial
government departments’ mobile voice and data communications contract for a period of four years. This
award will enable us to partner with government to support
greater innovation. Customer migration for this contract is
expected to commence in the first quarter. We are
leveraging our network reliability and our leading mobile
brand to move more deeply into fixed-line. Fixed-line and
business managed services (BMS) revenue increased 8.3%
with growth in cloud and hosting revenue gaining further
momentum as it increased by 35.2% in the year. Internet of
Things (IoT) revenue increased 19.1% to R662 million.
EBITDA increased 7.2% to R26 815 million with EBITDA
margin expanding strongly by 1.2ppts to 41.4% due to
strong focus on cost efficiencies and driven by sales margin
improvement. We focused on driving efficiencies across all
distribution channels. We rebalanced our subsidies towards
data-enabled devices, resulting in improved take up of data
services and improved returns. We benefited from improved
inventory management, reduced office accommodation
spend as we rationalised offices and various network cost
savings. These cost-savings initiatives have offset higher
network operating costs due to increased number of sites
and a trading foreign exchange net loss of R250 million
(2016: R531 million net gain).
Capital expenditure of R8 471 million allowed us
to continue widening our 3G and 4G data coverage, improve
voice quality and increase data speeds. 4G coverage
increased to 75.8% of the population, up from 58.2% a year
ago reaching over 7 900 sites. We extended our high-speed
transmission to 92.1% of our sites. We completed the
development of our new customer management and billing
systems to future proof our operations and have migrated
all our consumer contract customers to this new platform.
We also entered into a commercial agreement with WBS
that enables us to roam on their 4G and 4G+ network.
Our focus on customer experience improvements through network enhancements,
better value propositions and service, through our CARE initiative, has enabled us to increase our customer
satisfaction lead to 17 points over our nearest competitor
as measured through the net promoter score methodology.
We have underpinned our best network promise with
our dropped-call compensation guarantee, giving
customers free minutes for calls dropped on our network.
As customers become more digital, we are positioning the
MyVodacom app as customers’ primary interaction channel
with Vodacom for people with smartphones. The app
enables a number of self-help features, up-to-date bundle
and balance information with an easy interface to buy our
bundles. We continue to drive higher usage of the app
through promotional offers and consistent improvement
of the app, to deliver improved functionality.