Downloads
Our business
Our performance
Governance review
Other
- BEE certificate
- Corporate environmental policy
- ISO 14001 certificate
- KPI assurance definitions report

Our business
Our performance
Governance review
Other

Maintaining a positive reputation is key to managing the critical relationships that we depend on to create value (click here). Building on the substantial societal benefits of our core business activities through focused partnerships and investments form an important part of maintaining our strong reputation.


Proactive engagement with government and stakeholders to ensure achievement of each country’s broadband goals and contribute to initiatives that make a positive impact on societies.
Clear reputation leadership among telcos in all markets.


How we’ve done in our annual Reputation Survey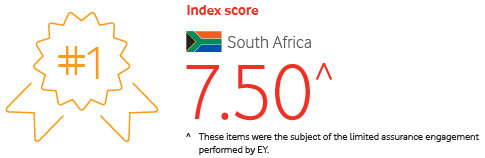 |
Maintaining a positive reputation is key to managing the critical relationships that we depend on to create value (page 16). Building on the substantial societal benefits of our core business activities through focused partnerships and investments form an important part of maintaining our strong reputation.
We use our annual Reputation Survey conducted with key internal and external stakeholders to track our progress and benchmark our reputation against our competitors and other leading brands. An independent company conducts this survey on our behalf. This year, we have again maintained the number one leadership position relative to our competitors in the telecoms sector in South Africa.
During the year, we won various external awards, reflecting an external perspective on our reputation leadership:
The provision of reliable and affordable voice and data services is a powerful driver of GDP growth and has enormous potential in addressing key socioeconomic challenges. We have aligned our strategic priorities with the national developmental objectives in our countries of operation, and are partnering with a range of stakeholders to deliver on these strategies.
Vodacom remains committed to working with governments and communities to find innovative ways through which mobile communication technologies can support financial inclusion, food security, health, access to education and other priorities. We are making a significant contribution to each of these areas both through our core business activities and through the strategically aligned work of the Vodacom Foundation.
As a responsible multinational company, we understand that it is in our interest – and the interest of our stakeholders – to ensure that the public services and infrastructure we rely on are fit for purpose and remain properly funded, including through a transparent, fair and effective system of taxation. Our operating businesses are subject to more than 30 different types of taxes and fees every year, of which a significant number relate specifically to the telecommunications industry. In 2016, we contributed R14 710 million in cash to the public finances in our countries of operation, up from R13 575 million in 2015. This increase is primarily due to an increase in taxable income resulting in higher corporate taxes, as well as an increase in licence fees and telecommunications related taxes. The Group’s total tax charge was R5 934 million. The difference between the total tax contribution and the tax charge primarily relates to telecoms specific taxes and other indirect taxes such as value-added tax and employment taxes. Our separately available Public finances report 2016 provides a comprehensive country-by-country review of Vodacom’s contribution to public finances in our countries of operation.

This year, based on our score, Vodacom is the most empowered JSE listed company in the ICT sector in South Africa. For the third year running we retained our Level 2 BEE contributor status, achieving a score of 98.25. This reflects our commitment to implementing meaningful and sustainable transformation for our employees, the people of South Africa and the economy as a whole.
We achieved good scores across each of the main rated elements:
BEE scorecard
| Element | Weighting | 2016 | 2015 | Variance | ||||
| Ownership | 20 | 19.79 | 12.23 | +7.56 | ||||
| Management/control | 10 | 11.00 | 11.00 | Par | ||||
| Employment Equity | 10 | 6.96 | 6.67 | +0.29 | ||||
| Skills development | 17 | 14.07 | 12.30 | +1.77 | ||||
| Preferential procurement | 20 | 23.43 | 22.53 | +0.90 | ||||
| Enterprise development | 11 | 11.00 | 11.00 | Par | ||||
| Socioeconomic development | 12 | 12.00 | 12.00 | Par | ||||
| Total | 100 | 98.25 | 87.73 | +10.52 |
A more detailed review of our societal impacts and contribution is provided in Vodacom’s sustainability report 2016.
The report, which constitutes the annual report of Vodacom’s Social and Ethics Committee, reviews our performance and activities in the following material areas:
A summary of our sustainability performance is presented in the following table:
| Indicator | 2016 | 2015 | |||
 |
Investing in our people | ||||
| Number of full time permanent employees | 7 538 | 7 786 | |||
| Salaries and benefits (Rm) | 5 599 | 4 886 | |||
| Women representation in Executive Committee (%) | 18.0 | 17.0 | |||
| Black representation in Executive Committee (%) | 55.0 | 58.0 | |||
| Ratio of average basic salary of men to women# (times) | 1.3 | 1.4 | |||
| Total training spend (Rm) | 103 | 130 | |||
| Workplace-related fatalities (employees and contractors) | 4 | 3 | |||
| Lost time injury frequency rate (LTIFR) | 0.11 | 0.10 | |||
 |
Delivering social value | ||||
| Active customers (thousand) | 61 305 | 61 648 | |||
| Active M-Pesa customers (thousand) | 9 224 | 7 991 | |||
| Investment in infrastructure (Rm) | 12 875 | 13 305 | |||
| Total cash tax contribution (Rm) | 14 710 | 13 575 | |||
| Investment in communities (Rm) | 106 | 96 | |||
 |
Product and service responsibility | ||||
| Customer NPS in South Africa (ranking relative to competitors) | 1st | 1st | |||
 |
Responsible envir onmental management | ||||
| Access network electricity# (GWh) | 282.0 | 255.0 | |||
| Core network electricity# (GWh) | 81.0 | 62.0 | |||
| Building electricity# (GWh) | 50.0 | 59.0 | |||
| Vehicle fuel (diesel and petrol)# (million litres) | 1.3 | 1.6 | |||
| Network equipment and handsets reused or recycled# (tonnes) | 1 006 | 160 | |||
| CO2 emissions1 (tonnes) | 576 872† | 561 515† |
1. Total scope 1, 2 and 3 emissions (Greenhouse Gas Protocol).
# South Africa only.
† Restated to exclude Tanzania base stations.
